DEFINITION

Knowledge Map

A knowledge map is a structured, evolving model of what an engineer or team understands across a codebase's concepts, systems, and technologies.

A knowledge map turns scattered evidence of understanding into a navigable picture: which concepts an engineer has demonstrated mastery of, which they are still building, and where the blank spots are. Think of it as a skills graph grounded in real work rather than a self-assessment survey.
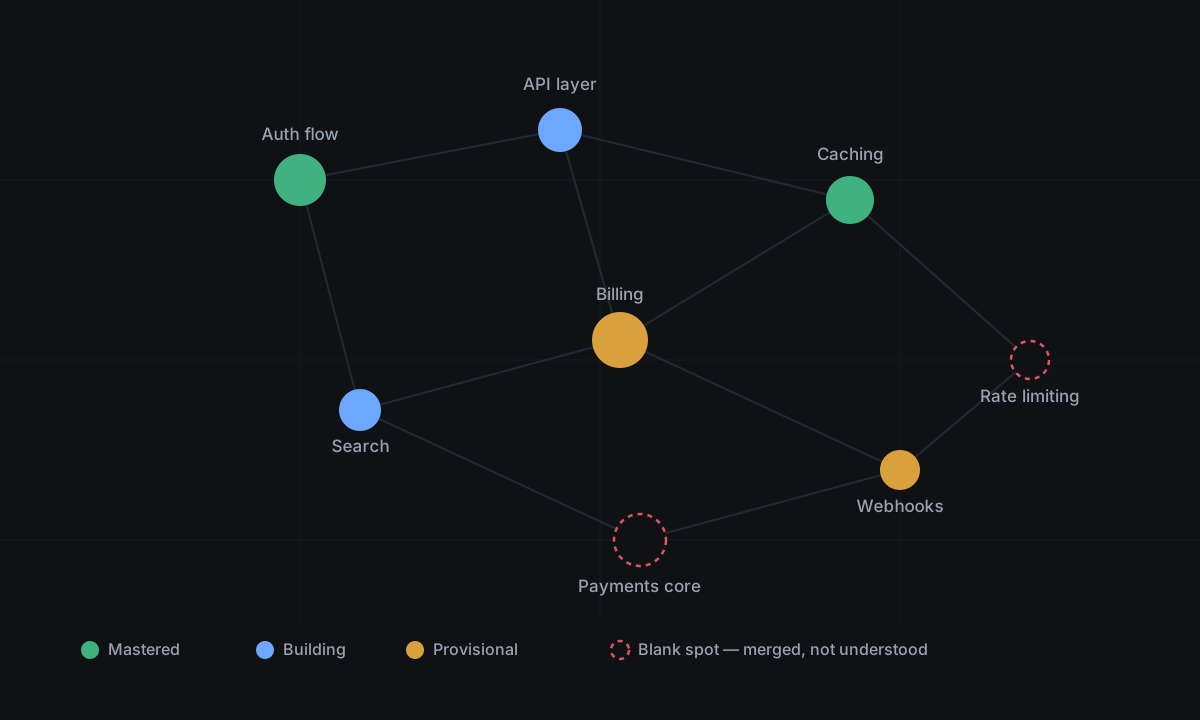
A knowledge map showing concept nodes across a codebase — auth, caching, billing, payments — colored by demonstrated mastery, with two systems marked as blank spots that were merged but not understood.
A knowledge map grades each concept by demonstrated understanding, not self-report — and makes the blank spots impossible to miss.

Each node represents a concept or system — an authentication flow, a caching strategy, a particular framework — and its state reflects accumulated evidence from the engineer's actual changes and comprehension checks. As they work, the map updates: mastery deepens where understanding is demonstrated and stays provisional where code was merged without it.

For teams, the aggregate map reveals concentration risk (only one person understands a critical system) and guides where learning investment pays off most. It is the durable artifact behind Engineering Intelligence.

Frequently asked questions

How is a knowledge map different from a skills matrix?
A skills matrix is usually self-assessed and static — people rate themselves against a list. A knowledge map is evidence-based and evolving: each concept's state reflects accumulated proof from real changes and comprehension checks, so it updates as people work and can reveal gaps a self-rating would hide.
What does a blank spot on a knowledge map mean?
A blank spot is a concept or system that code has been merged against but that no one on the team has demonstrably understood. Blank spots on business-critical systems are the highest-value places to invest learning — and exactly what a velocity dashboard cannot see.
How does a team knowledge map reveal concentration risk?
When only one engineer has demonstrated mastery of a critical system, the aggregate map shows that system depending on a single person — a bus-factor of one. The map surfaces that risk before it becomes an incident during an outage or a departure.

Related terms

Engineering IntelligenceDeveloper UpskillingMasteryComprehension Check

Turn shipping into understanding

Cartara measures what your team actually learns from every AI coding session.

Join the waitlist